RFM is a behavioral marketing segmentation technique that direct marketers have been using for years to identify their best customers in order send them special, tailored offers.
RFM stands for Recency (when the customer placed the last order), Frequency (how many orders the customer placed in a period of time) and Monetary (how much money the customer spent). It relies on the premise that someone who recently bought something, who shopped often and who spent a lot is more likely to respond to your next campaign than someone who bought something a long time ago, shopped infrequently and spent next to nothing.
Because RFM has been a direct-marketing staple for so many years, there are a great number of data-mining and statistical analysis tools that generate ready-made RFM-classification reports. However, if you don’t have access to or don’t use statistical analysis tools, fear not. Unlike other predictive-modeling techniques, RFM is based on past customer behavior and does not require heavy statistics-driven analysis or special tools, and you can actually create your own model fairly easily.
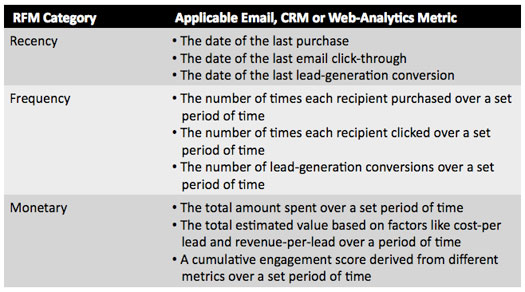
First you need to determine the parameters to use in your analysis. Email marketing allows you to measure customer interaction and engagement in many more ways than other direct marketing/mailing could ever do. Depending on your email database and marketing strategy, other metrics can be used in place of the traditional RFM parameters, giving you many different ways to perform an RFM analysis:
Once you’ve decided which metrics make the most sense for your business, you’ll need to tie your email database to the system that contains purchase or conversion history, such as your CRM or Web-analytics tool.
Now you are ready to perform RFM segmentation.
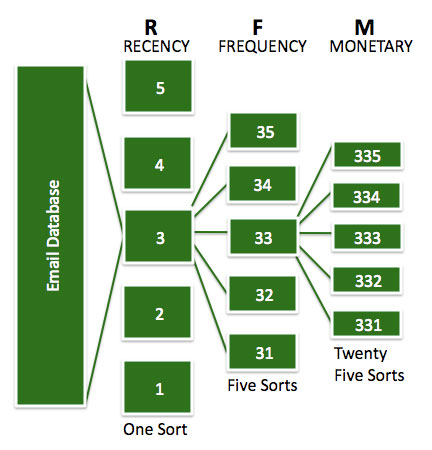
One way to perform RFM segmentation is to simply sort your list for recency, in order of highest to lowest. You then divide the list into five equal segments, giving the top 20% a recency score of 5, the next 20% a score of 4 and so on.
Each recency segment is then sorted and scored for frequency – from the most to least frequent, coding the top 20% as 5, and the less frequent quintiles as 4, 3, 2, and 1. This resuls in 25 recency plus frequency segments.
Each of these segments is then sorted for monetary and divided into five equal segments again with each segment being scored — the big spenders score a 5, and the others, 4, 3, 2, and 1. You now have 125 segments that have RFM scores ranging from 555 to 111. This is your RFM index.
Using the quintile system explained above, all customers end up with three digits in their database records. They are either 555, 554, 553, 552, 551, 545,…down to 111.

Of course, depending on the size of your database, you could divide it into deciles or other n-tiles, instead of quintiles. Or if you are very familiar with your database, you could simply use intuitive groupings, such as “purchased in last month, last three months, last six months or greater than six months,” as the basis for your RFM classifications.
As you can see, RFM is very adaptable, and with some experimentation, you will be able to obtain dramatic lift gains.


